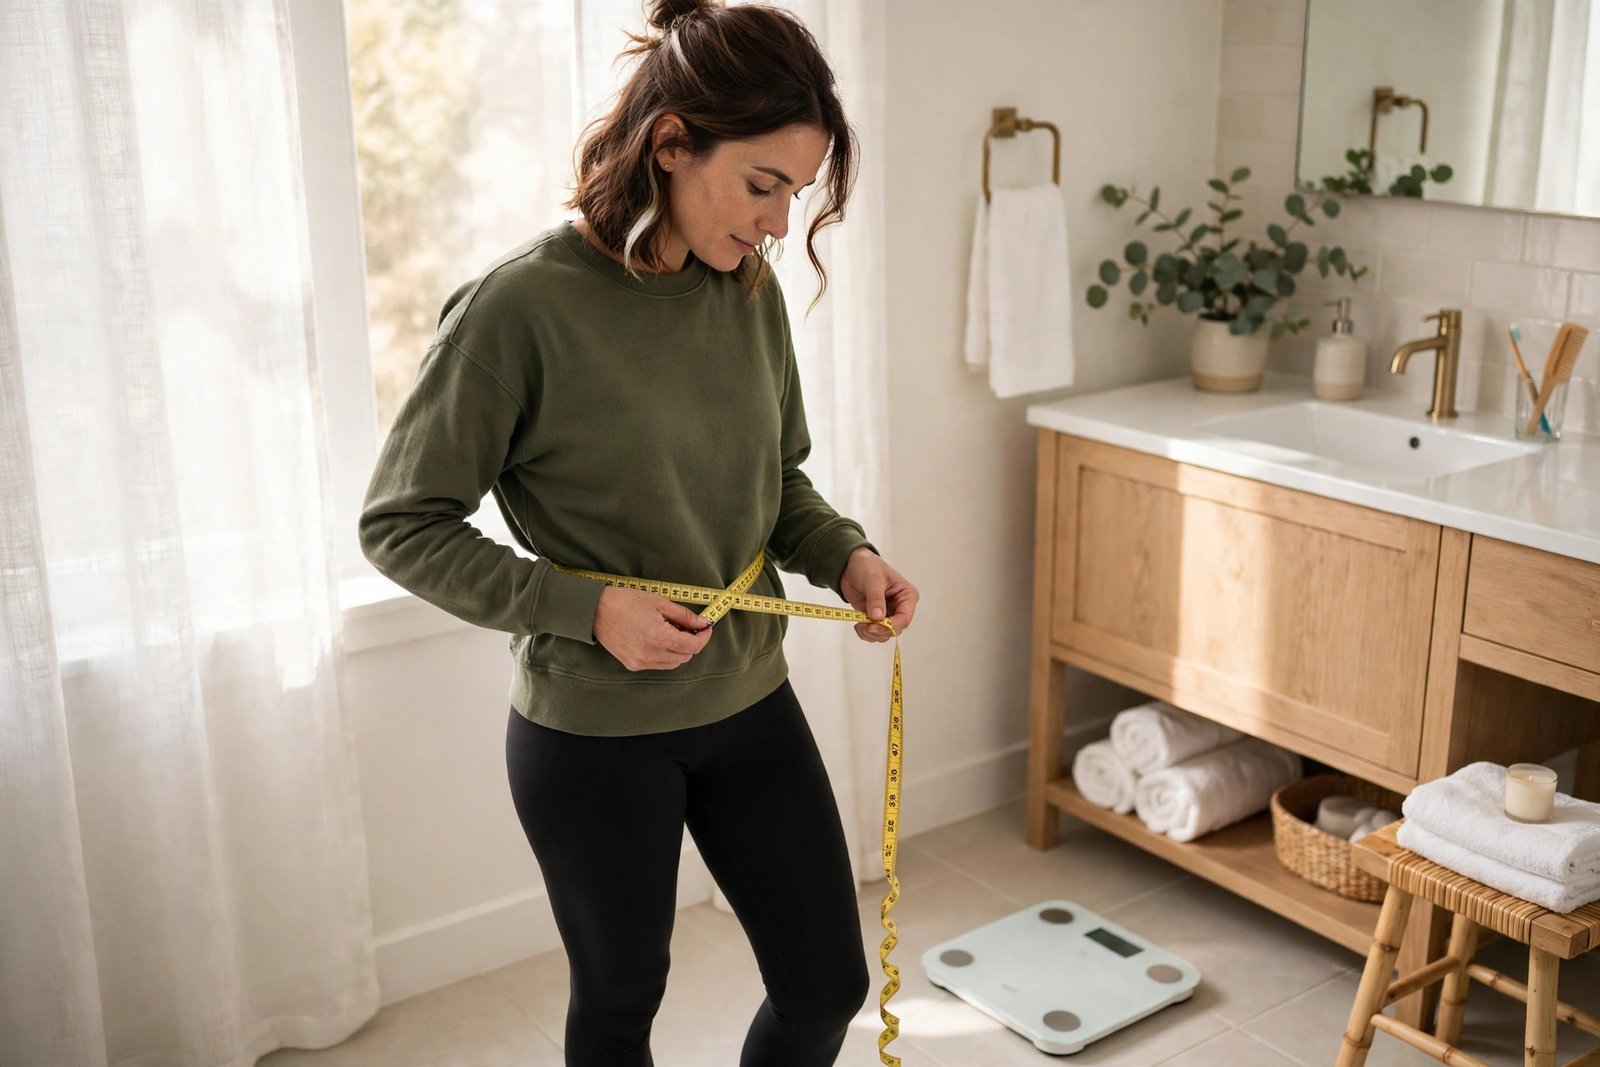
Body Fat Percentage Calculator
How to use this calculator
- Choose US units (pounds and inches) or metric units (kilograms and centimetres).
- Select your gender, then enter your weight, height and tape measurements: waist and neck for men, waist, hip and neck for women.
- Measure your waist at the navel if you are a man, or at the narrowest point if you are a woman. Measure your neck just below the Adam’s apple, and your hip at the widest point. Keep the tape level and snug, and breathe out naturally.
- Click Calculate Body Fat Percentage to see your result, your fat mass and your lean mass.
Your body fat percentage
What your result means
Your body fat percentage is the share of your weight that is fat. The rest is lean mass: muscle, bone, organs and water. Two people can weigh the same and have very different percentages, which is why this number tells you more about your shape than the scale alone. Use it to track change over time, measured the same way each month, rather than as a single verdict on your health. A DEXA scan is the reference method if you want an exact figure.
Your report downloads as a PDF you can keep or share with your doctor. No email needed.
Body fat percentage is the share of your weight that is fat. The rest is lean mass: muscle, bone, organs and water. It tells you more about your shape than the scale alone, because two people can weigh exactly the same and carry very different amounts of fat. A muscular person and a sedentary person can share a weight and even a BMI, yet look and feel completely different, and face different health risks.
This calculator estimates your body fat percentage from your gender, weight, height and tape measurements: waist and neck for men, waist, hip and neck for women. It also works out your fat mass and your lean mass in kilograms and pounds, so you can see what the percentage means in real weight. Use it to track change over time: measure the same way each month and watch the direction, rather than treating one reading as a final verdict.
To use it, choose US units or metric units, select your gender, enter your weight, height and tape measurements, and click Calculate Body Fat Percentage. The sections below show exactly how the number is worked out, with two full examples using real numbers, one man and one woman, each shown in both unit systems, so you can check the maths yourself. They also explain what counts as a healthy range, how to turn a percentage into a weight target, and where this kind of estimate falls short.
How this calculator works
The calculator uses the true U.S. Navy body fat method, developed by Hodgdon and Beckett at the Naval Health Research Center in 1984 from body circumference measurements. For men it measures the abdomen and neck plus height. For women it measures the waist, hip and neck plus height. The formula first estimates body density from those tape measurements, then turns density into a body fat percentage with the Siri equation: body fat % = 495 / density - 450.
For men, the formula is: body fat % = 495 / (1.0324 - 0.19077 x log10(waist - neck) + 0.15456 x log10(height)) - 450. For women, it is: body fat % = 495 / (1.29579 - 0.35004 x log10(waist + hip - neck) + 0.22100 x log10(height)) - 450. All measurements are in centimetres inside the formula. If you enter US units, the calculator converts inches to centimetres first (multiply by 2.54), so the same person gets the same answer in either unit system. Your weight is converted to kilograms (pounds x 0.453592) and is used only for your fat mass and lean mass, not for the percentage itself. The result is shown to two decimal places.
Two things to know about this tool. First, it does not ask for your age, because the Navy formula has no age term. Age matters for what counts as a healthy range, which rises as you get older, but it plays no part in this calculation. Second, the calculator shows your fat mass and lean mass alongside the percentage. Fat mass is your weight multiplied by the percentage, and lean mass is everything else. Those two numbers are often more useful than the percentage alone, because they show whether a change on the scale came from fat or from muscle.
One more honest note: the tape is the weak point. A tape pulled tight, held at the wrong place, or read after a big meal can move the result by a few points. Measure carefully, at the same places each time, and treat the figure as an estimate. The worked examples below show the full working, so you can check every step yourself.
Worked example: a 35 year old man, 180 lb, 70 in
Take a 35 year old man who weighs 180 pounds and is 70 inches tall, with an abdomen of 36 inches and a neck of 16 inches. Work through the same steps the calculator uses, with his numbers in the formula.
Step 1, convert the units. Weight in kilograms is 180 x 0.453592 = 81.65 kg. Height in centimetres is 70 x 2.54 = 177.80 cm. Abdomen is 36 x 2.54 = 91.44 cm, and neck is 16 x 2.54 = 40.64 cm.
Step 2, the first term. Waist minus neck is 91.44 - 40.64 = 50.80 cm. log10(50.80) = 1.70586, and 0.19077 x 1.70586 = 0.32543.
Step 3, the second term. log10(177.80) = 2.24993, and 0.15456 x 2.24993 = 0.34775.
Step 4, put it together. Body density is 1.0324 - 0.32543 + 0.34775 = 1.05472. Then 495 / 1.05472 = 469.32, and 469.32 - 450 = 19.32%. Enter the same details into the calculator above and you will get exactly that number: 19.32%.
The same man in metric units, 81.65 kg, 177.80 cm, abdomen 91.44 cm, neck 40.64 cm, goes through the same steps with no conversion, and gets exactly the same answer: 19.32%. That is how it should be: the unit system must not change the result.
What does 19.32% mean in weight? His fat mass is 81.65 x 19.32 / 100 = 15.77 kg (34.77 lb), and his lean mass is 81.65 - 15.77 = 65.87 kg (145.23 lb). On the ranges used on this page, 19.32% sits in the Average band for men (18 to 24%). His BMI is 25.8, just over the 25 line that marks overweight, yet his body fat sits in the average range. That gap is the whole point of this calculator: BMI only knows weight and height, so it cannot tell muscle from fat, while a body fat estimate at least tries to split the two. Check your own numbers with the BMI calculator and compare the two stories.
Second example: a 30 year old woman, 140 lb, 65 in
Take a 30 year old woman who weighs 140 pounds and is 65 inches tall, with a waist of 30 inches, hips of 38 inches and a neck of 13 inches. The steps are the same, with the women's formula.
Step 1, convert the units. Weight in kilograms is 140 x 0.453592 = 63.50 kg. Height in centimetres is 65 x 2.54 = 165.10 cm. Waist is 30 x 2.54 = 76.20 cm, hips are 38 x 2.54 = 96.52 cm, and neck is 13 x 2.54 = 33.02 cm.
Step 2, the first term. Waist plus hip minus neck is 76.20 + 96.52 - 33.02 = 139.70 cm. log10(139.70) = 2.14520, and 0.35004 x 2.14520 = 0.75090.
Step 3, the second term. log10(165.10) = 2.21775, and 0.22100 x 2.21775 = 0.49012.
Step 4, put it together. Body density is 1.29579 - 0.75090 + 0.49012 = 1.03501. Then 495 / 1.03501 = 478.26, and 478.26 - 450 = 28.26%. Enter the same details into the calculator above and you will get exactly that number: 28.26%.
The same woman in metric units, 63.50 kg, 165.10 cm, waist 76.20 cm, hips 96.52 cm, neck 33.02 cm, gets exactly the same answer: 28.26%. Her fat mass is 63.50 x 28.26 / 100 = 17.94 kg (39.56 lb), and her lean mass is 63.50 - 17.94 = 45.56 kg (100.44 lb). At 28.26% she sits in the Average band for women (25 to 31%). Her BMI is 23.3, inside the healthy range, so for her the two tools agree: healthy by BMI, average by body fat.
Notice what the two examples show together. The man is called overweight by BMI and average by body fat. The woman is called healthy by both. The man also carries far more lean mass (65.87 kg against 45.56 kg) because he is a bigger person, which is why his weight is higher even though his body fat percentage is lower. Losing weight is not only about the percentage falling: if he loses 5 kg of muscle along with 5 kg of fat, his percentage barely moves. That is why the lean mass figure matters. When you recheck in a month, look at both numbers, not just the headline percentage.
What counts as a healthy body fat percentage
There is no single ideal number. Healthy ranges rise with age and differ by sex, because women naturally carry more essential fat for hormonal function. The ranges below are the ones used by the American Council on Exercise, and they match the bands this calculator reports.
| Category | Men | Women |
|---|---|---|
| Essential fat | 2 to 5% | 10 to 13% |
| Athletes | 6 to 13% | 14 to 20% |
| Fitness | 14 to 17% | 21 to 24% |
| Average | 18 to 24% | 25 to 31% |
| Obese | 25% and above | 32% and above |
Essential fat is the minimum the body needs to work properly: it cushions organs, insulates the body and supports hormone production. Dropping below it is dangerous, not an achievement. Athletes sit low because their training keeps fat down and muscle up, but most people do not need an athlete's number to be healthy. The Average band is where most healthy adults sit, and moving from the Obese band into the Average band is a realistic goal that brings real health benefits.
Age shifts the picture. Research linking healthy BMI ranges to body fat (Gallagher and colleagues, 2000) found that the body fat percentage matching a healthy BMI rises with age: a 25 year old and a 65 year old can share the same BMI yet carry different amounts of fat, with the older person carrying more. So a 50 year old at 26% is in a different position from a 25 year old at 26%. Judge your number against people your own age and sex, not against a 20 year old athlete.
Where fat sits matters too. Fat around the waist carries more health risk than fat on the hips and thighs, even at the same total percentage. If your waist has grown while your weight stayed steady, that is worth knowing. The waist to hip ratio calculator measures that split, and if your weight has shifted around menopause, the guide to menopause belly fat explains why the waist changes first at that stage of life.
From a percentage to a plan: loss, maintenance and gain
A percentage becomes useful when it turns into a target weight. Take the first worked example: a 35 year old man at 81.65 kg with 65.87 kg of lean mass. If he keeps his lean mass and aims for a lower body fat percentage, his target weight is lean mass divided by one minus the target percentage. Here are his targets:
| Target body fat | Target weight | Fat to lose from 81.65 kg |
|---|---|---|
| 12% (athlete band) | 74.86 kg (165.0 lb) | 6.79 kg |
| 15% (athlete edge) | 77.50 kg (170.9 lb) | 4.15 kg |
| 17% (top of fitness) | 79.37 kg (175.0 lb) | 2.28 kg |
| 19% (just below now) | 81.33 kg (179.3 lb) | 0.32 kg |
To reach 15% he needs to lose about 4.15 kg of fat while keeping his muscle. At a deficit of about 300 to 500 calories a day below his daily burn, that is roughly 9 to 15 weeks of steady loss, since a kilogram of body fat holds about 7,700 calories. A bigger deficit would be faster but would cost more muscle, which is the opposite of what he wants: losing muscle lowers his lean mass, and a lower lean mass makes the same percentage harder to hold.
For maintenance, the job is simpler: eat near your daily burn, keep strength training twice a week, and recheck monthly. For muscle gain, the target runs the other way: a small surplus of about 200 to 300 calories a day above maintenance, with strength training, adds mostly muscle if protein is looked after. The protein intake calculator gives a personal protein target, and the TDEE calculator gives the daily burn to work from. The weight loss goal calculator turns the target into a dated plan with a weekly pace, and the macro calculator splits the daily calories into protein, carbohydrate and fat.
One caution on the table above: it assumes lean mass stays fixed, which is only true if you strength train while you lose weight. Without training, a typical weight loss splits roughly three parts fat to one part muscle, so the real target weight for 15% would be lower than 77.50 kg, and the body would be weaker at that weight. Keep the muscle, and the maths works in your favour.
Body fat percentage vs BMI
BMI divides weight by height squared and sorts the result into underweight, healthy, overweight and obese. It is quick, it needs no equipment, and it works well for whole populations. For one person it has a blind spot: it cannot see composition. The first worked example shows it clearly. At 81.65 kg and 177.80 cm his BMI is 25.8, which the BMI bands call overweight, yet his body fat estimate is 19.32%, in the Average band. A rugby player can score a BMI of 30, the obese line, while carrying 15% body fat. An older adult can score a healthy BMI of 22 while carrying 30% body fat and very little muscle, a state sometimes called normal weight obesity.
That does not make BMI useless. BMI is still the number doctors use first, because it is measured the same way everywhere and it tracks well with health risk across large groups. Body fat percentage is the better number for tracking your own change, because it separates fat from muscle. Use both: BMI for the quick check, body fat for the trend, and waist to hip ratio for where the fat sits. If the three disagree, trust the trend over months, not any single reading.
Your resting burn also depends on composition, not just weight. Muscle uses more energy at rest than fat, so two people of the same weight can burn different amounts. The BMR calculator estimates your resting burn from your age, weight, height and sex, and the ideal weight calculator shows the weight range that matches a healthy BMI for your height. Together the four tools give a fuller picture than any one of them alone.
Common mistakes
The first mistake is treating one reading as the truth. Body fat estimates move with hydration, food, and the method used, so a single number can be several points out. Measure under the same conditions each time, once a month, and judge the trend over three months.
The second mistake is chasing the athlete band. Essential fat for men starts at 2% and for women at 10%, and living near those floors is risky: hormones, immunity and mood all suffer. The Average band is a healthy home for most people, and the Fitness band is a strong goal for someone who trains regularly.
The third mistake is watching the percentage while ignoring lean mass. If you lose 2 kg of fat and 2 kg of muscle, your weight falls 4 kg but your percentage barely changes, and you are weaker for it. Strength train while you lose weight, and check that your lean mass is holding steady.
The fourth mistake is comparing your number with someone else's from a different method. A DEXA scan, a tape measure Navy test, a skinfold test and this calculator will give four different answers for the same body on the same day. Pick one method, use it the same way each time, and compare only with your own past readings.
The fifth mistake is using body fat as the only measure of health. Blood pressure, blood sugar, cholesterol, fitness, sleep and mood all matter, and a person at 28% who trains, sleeps well and eats sensibly can be healthier than a person at 16% who does none of those things. The number is a tool, not a verdict.
Limitations: what this calculator cannot do
This calculator gives an estimate, not a measurement. It works from tape measurements, and the tape is only as good as the person holding it. A waist measured an inch too high or too low, a tape pulled tight, or a reading taken after a big meal can move the result by a few points. Very muscular people can read higher than they really are, because the formula was built from average bodies, and very lean people with little muscle can read lower. For an exact figure, the reference methods are DEXA scans and hydrostatic weighing, which are expensive and not widely available, which is why calculators like this one are popular for tracking change over time.
The method itself has limits too. It was developed from U.S. Navy personnel, who were mostly young and fit, so it fits that kind of body best and is less tested on older adults, on very tall or very short people, and on people with a lot of weight to lose. It cannot see where your fat sits beyond the waist and hip measurements, and it cannot tell you anything about your blood pressure, blood sugar or cholesterol. Your age is not part of the calculation, so two people with the same measurements get the same number at 25 and at 65, even though the healthy range shifts with age.
The calculator is designed for adults. It is not suitable for children or teenagers, whose body composition changes as they grow, and it is not designed for pregnancy, where weight and shape change for reasons the formula cannot see. If you have a health condition, take medication that affects weight, or have an eating disorder history, speak with a healthcare professional instead of relying on this number.
Use the result as a starting point. Measure monthly, under the same conditions, and look at the three month trend. If your percentage is falling while your lean mass holds steady, the plan is working. If it is not moving, adjust food or activity by a small step and try again. The calculator gives you the first guess; your own results give you the correction.
How to use the body fat percentage calculator
Choose US units if you think in pounds and inches, or metric units if you think in kilograms and centimetres. Select your gender, enter your weight, height and tape measurements, then click Calculate Body Fat Percentage. Your percentage appears with your fat mass and lean mass, the range it falls in, and the formula with your own numbers filled in, so you can see exactly how it was worked out. Download the PDF report if you want to keep the result, then use the related calculators below to check your BMI, your daily burn and your weight loss goal.
Last updated: 9 November 2026.
Frequently asked questions about body fat percentage
How does the body fat percentage calculator work?
It uses the true U.S. Navy body fat method, from tape measurements. For men the formula is 495 / (1.0324 - 0.19077 x log10(waist - neck) + 0.15456 x log10(height)) - 450, and for women it is 495 / (1.29579 - 0.35004 x log10(waist + hip - neck) + 0.22100 x log10(height)) - 450, with all measurements in centimetres. The calculator also works out your fat mass and your lean mass from the result. It does not ask for your age, because the Navy formula has no age term. Try the worked example above: a 35 year old man, 180 pounds, 70 inches, 36 inch waist and 16 inch neck, gets 19.32%, with 15.77 kg of fat and 65.87 kg of lean mass.
What is a healthy body fat percentage?
It depends on your sex and your age. The ranges used by the American Council on Exercise are 2 to 5% essential fat, 6 to 13% athletes, 14 to 17% fitness, 18 to 24% average, and 25% and above obese for men; and 10 to 13% essential fat, 14 to 20% athletes, 21 to 24% fitness, 25 to 31% average, and 32% and above obese for women. Healthy ranges rise with age, so judge your number against people your own age and sex. The Average band is a healthy home for most people, and moving from the Obese band into the Average band brings real health benefits.
How accurate is this calculator?
It is a rough estimate, and it is honest about that. The result depends on the tape: a waist measured an inch too high or too low, a tape pulled tight, or a reading taken after a big meal can move the number by a few points. The method was also developed from U.S. Navy personnel, who were mostly young and fit, so it fits that kind of body best. Very muscular people will read higher than they really are. For an exact figure, a DEXA scan is the reference method. For tracking change over time, measure the same way once a month and watch the three month trend.
Why is body fat percentage better than BMI?
BMI only knows your weight and height, so it cannot tell muscle from fat. A muscular person can score a BMI of 30, the obese line, while carrying 15% body fat, and an older adult can score a healthy BMI of 22 while carrying 30% body fat and very little muscle. Body fat percentage tries to split the two, which makes it better for tracking your own change. The worked example shows it: a 35 year old man at 180 pounds and 70 inches has a BMI of 25.8, which the BMI bands call overweight, yet his body fat estimate is 19.32%, in the Average band. Use both numbers together, plus your waist to hip ratio, rather than trusting any one of them alone.
How often should I check my body fat percentage?
Once a month is enough for most people. Body fat changes slowly, and checking daily only adds noise from water, food and the method itself. Measure under the same conditions each time, at the same time of day, and look at the direction over three months. If your percentage is falling while your lean mass holds steady, the plan is working. If it is not moving, change one thing, food or activity, by a small step and try again.
Related tools and guides
- BMI Calculator - Check your body mass index and compare it with your body fat percentage.
- Basal Metabolic Rate (BMR) Calculator - Work out your resting burn, which depends on how much muscle you carry.
- Total Daily Energy Expenditure (TDEE) Calculator - See your total daily burn, the number your weight plan starts from.
- Macro Calculator - Split your daily calories into protein, carbohydrate and fat in grams.
- Protein Intake Calculator - Work out your personal protein target so you keep muscle while you lose fat.
- Waist to Hip Ratio Calculator - Check where your fat sits, because waist fat carries more risk than hip fat.
- Weight Loss Goal Calculator - Turn your target body fat percentage into a dated weight loss goal with a weekly pace.
Download your body fat report as a PDF
Sources
- Hodgdon JA, Beckett MB. "Prediction of percent body fat for U.S. Navy men and women from body circumference measurements." Naval Health Research Center Report No. 84-11, 1984. The U.S. Navy body fat formula this calculator takes its constants from. The original method uses abdomen and neck measurements for men, and waist, hip and neck for women, plus height.
- Gallagher D, Heymsfield SB, Heo M, Jebb SA, Murgatroyd PR, Sakamoto Y. "Healthy percentage body fat ranges: an approach for developing guidelines based on body mass index." American Journal of Clinical Nutrition. 2000;72(3):694-701. Healthy body fat ranges linked to BMI, showing the ranges rise with age. https://pubmed.ncbi.nlm.nih.gov/10966886/
- American Council on Exercise. "What Are the Guidelines for Percentage of Body Fat Loss?" The body fat category ranges used on this page for men and women. https://www.acefitness.org/resources/everyone/blog/112/what-are-the-guidelines-for-percentage-of-body-fat-loss/
- Mifflin MD, St Jeor ST, Hill LA, Scott BJ, Daugherty SA, Koh YO. "A new predictive equation for resting energy expenditure in healthy individuals." American Journal of Clinical Nutrition. 1990;51(2):241-247. The Mifflin-St Jeor equation used by the BMR calculator linked from this page. https://pubmed.ncbi.nlm.nih.gov/2305711/
This calculator is for general information only and is not medical advice. Speak with a healthcare professional before starting a diet or exercise plan.